In the middle of September we published about 30 new blog posts on each of three apartment building websites in Seattle, within two days of each other. Same process, same kind of content, same week.
Five weeks later, the results were not the same at all:
- Building A: weekly search impressions up 6.1x
- Building B: up 4.5x
- Building C: up 1.7x
Because everything else was held so close to equal, this is about as clean a comparison as you get with real client sites. Here is the data, what drove the growth, and the three differences we think explain why one site barely moved.
What we published
All three buildings are managed by the same company and are similar in size and price. Each got a batch of "renter guides": posts written for people looking for an apartment, never for the property management industry.
Every post followed the same two rules:
- Only two subjects. The neighborhood (commutes, food, parks, events, moving to the city) or the building itself (floor plans, amenities, parking, pets, specials, affordability programs).
- Built from a fact sheet. Each building has a sheet of verified facts: unit sizes, amenities, transit, current specials. Every post had to use those facts, not generic claims, and end with an invitation to tour.
Posts for Buildings A and B were drafted with an AI writing tool we built, grounded in each building's fact sheet, then checked by a person. Building C's batch went through a separate editing pass the same week after a quality review.
| Posts | Building A | Building B | Building C |
|---|---|---|---|
| Posts before the batch | 2 | 1 | 0 |
| Batch, Sept 14 to 15 | 31 | 29 | 25 |
| Added Oct 21 | 4 | 4 | 4 |
What happened
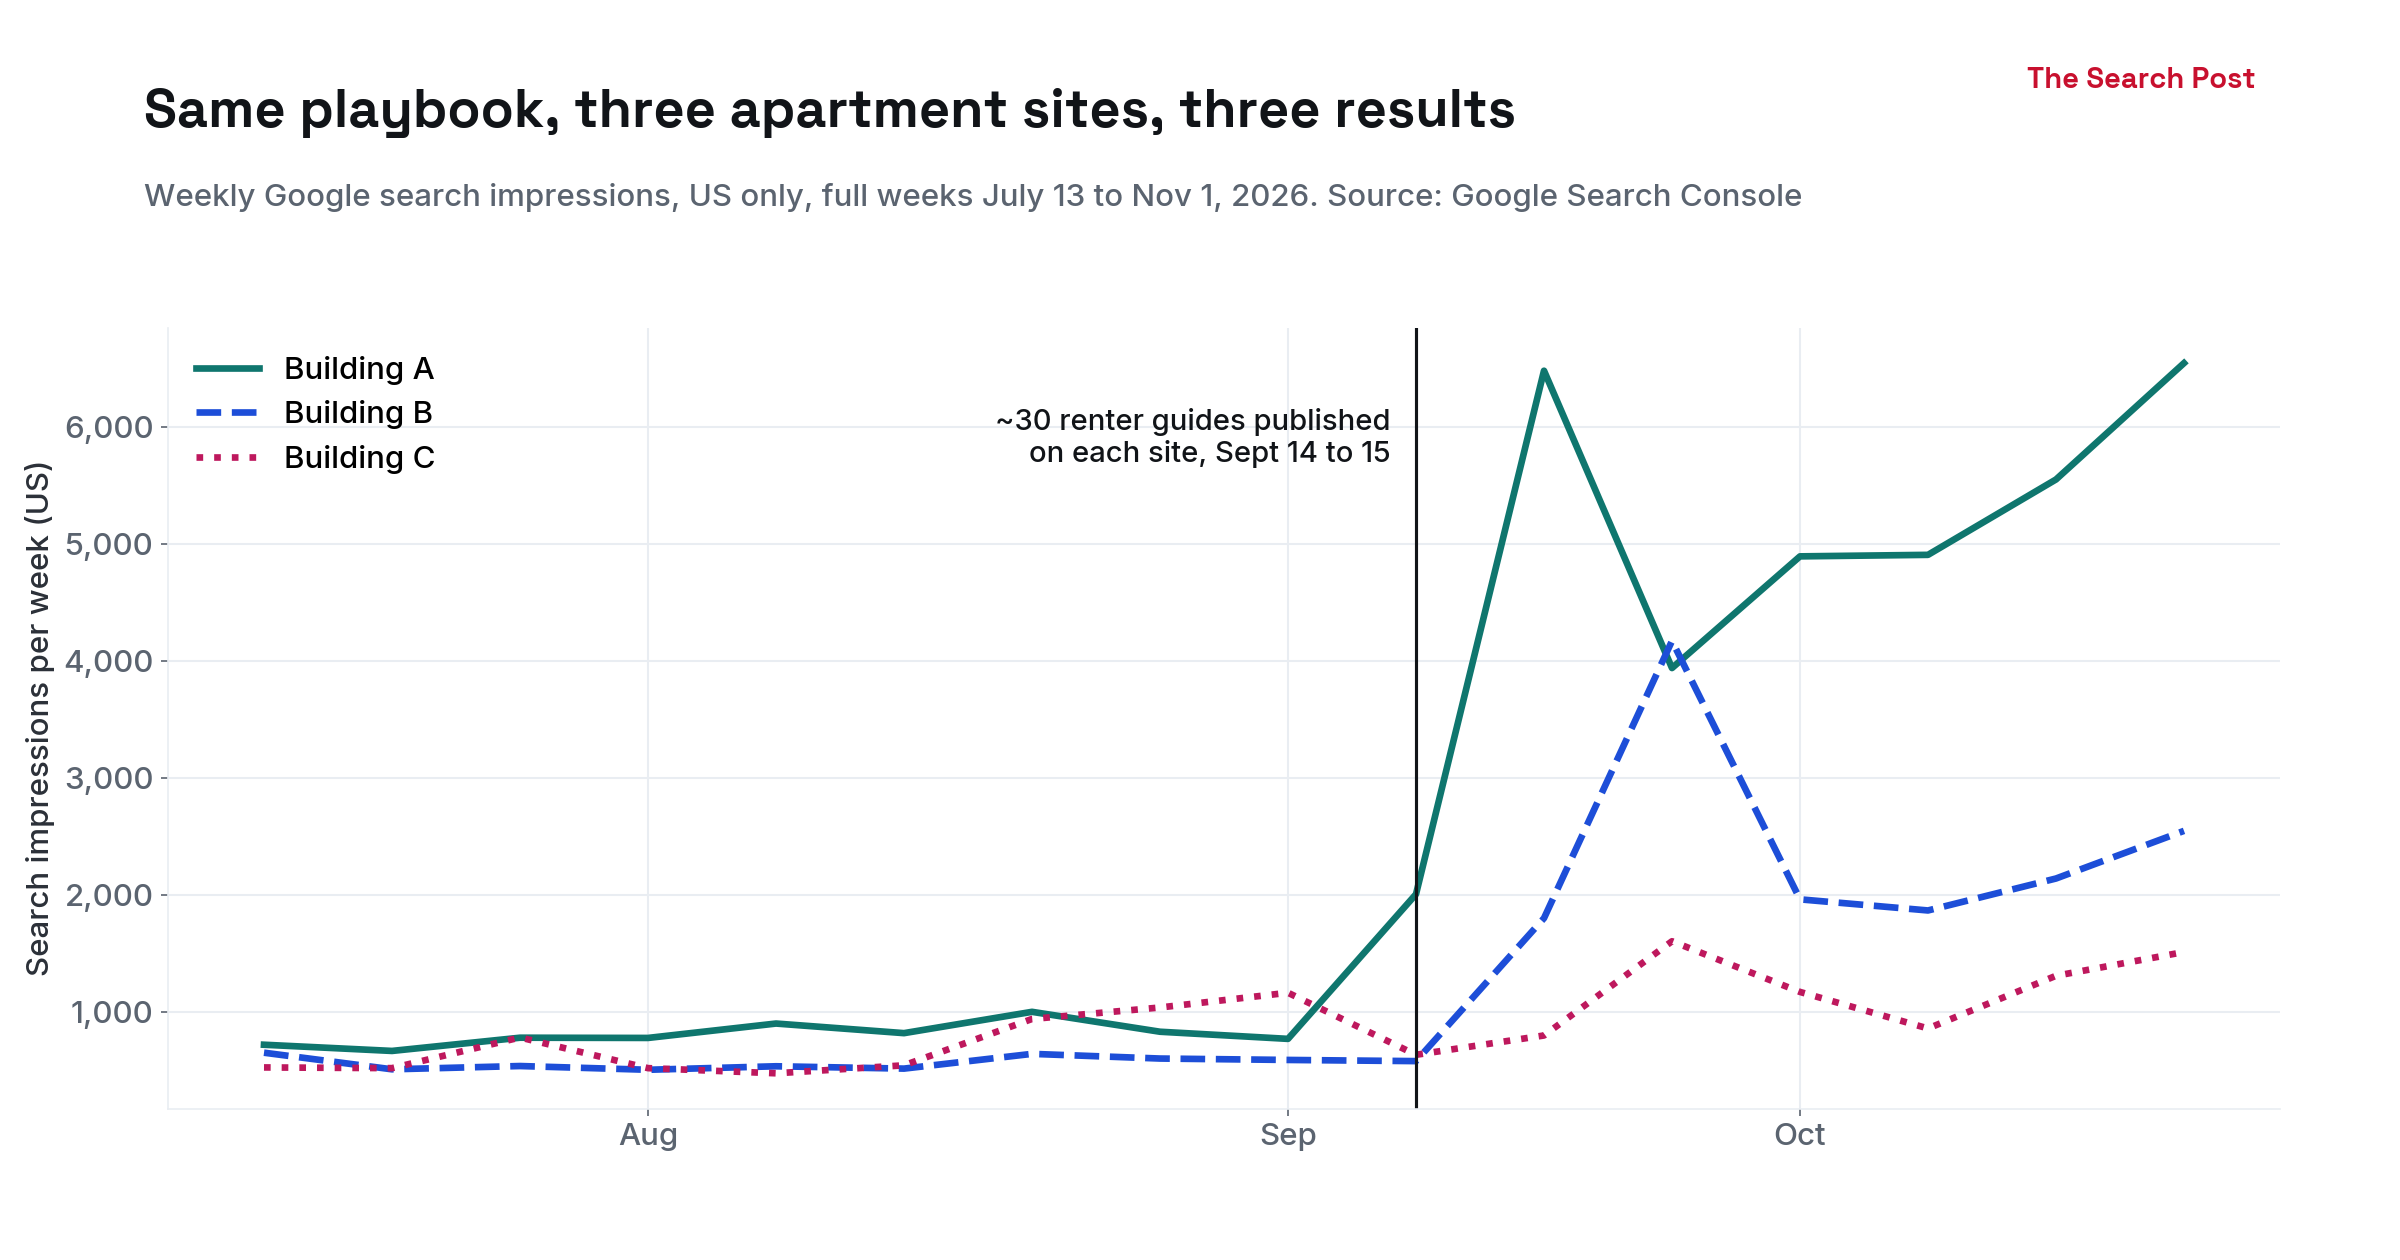
We compared six full weeks before the batch (Aug 3 to Sept 13) with five full weeks after it (Sept 28 to Nov 1), US searches only. We skipped the two weeks right after publishing, when Google was still discovering the new pages and numbers jumped around.
| Weekly average, US | Impressions before | Impressions after | Change | Clicks before | Clicks after | Change |
|---|---|---|---|---|---|---|
| Building A | 851 | 5,166 | 6.1x | 38.8 | 92.2 | 2.4x |
| Building B | 566 | 2,538 | 4.5x | 20.7 | 43.6 | 2.1x |
| Building C | 781 | 1,292 | 1.7x | 16.7 | 19.4 | 1.2x |
Two things stand out. Impressions moved fast: within one to two weeks of publishing. And clicks grew far less than impressions on every site.
Where the growth came from
For Building B we split the numbers by page. (We used all countries here, not just the US. Search Console's page reports drop a large share of clicks when you also filter by country; we explain that in our Search Console report tutorial.)
| Building B, weekly average | Before | After |
|---|---|---|
| Pages getting impressions | 12 | 75 |
| Clicks from the new renter guides | 0.2 | 21.4 |
| Impressions from the new renter guides | 50 | 2,368 |
| Clicks to the homepage | 19.3 | 23.0 |
The homepage barely changed. Almost all of the growth came from the new guides, which now bring in about as many clicks as the homepage does.
The best performers were not general city guides. They were posts about Seattle's MFTE affordable housing program: who qualifies, how it works, which buildings take part. The top one alone had 2,124 impressions in five weeks. That topic is specific, high intent, and something an apartment building can answer better than a general news site.
The click gap
The renter guides on Building B have a median average position of 7.4, which is on the first page. Yet only about 1% of the people who saw them clicked. The top MFTE guide got 23 clicks from 2,124 impressions at an average position of 9.8.
We don't know the cause yet. Average position blends many different searches, AI Overviews may answer some of these questions on the results page, and some searchers may be looking for listing sites rather than a building's blog. We are checking the actual results pages for the top queries and will report back.
Why Building C grew least
We can't separate these, but Building C differs from the other two in three ways:
- Its neighborhood gets far less search. Buildings A and B are in one of Seattle's most searched neighborhoods. Building C is in a smaller, quieter one. Fewer people search for its guides in the first place.
- Its topics were broader. Building C's batch covered pets, luxury living, general renting and the neighborhood. Buildings A and B leaned harder into questions only a local building can answer, like the affordability program.
- It named the building late. When we audited Building C's batch in September, the building's name first appeared, on average, 28.8% of the way into a post; 8 of 25 posts didn't name it until more than halfway through, and only 3 of 25 named it in the summary. On Buildings A and B today, the typical post names the building in its first sentence or two (median: the first 1% of the text). Posts that wait read as generic city guides with a building attached at the end.
If we could change only one thing for a site like Building C, it would be the topic list: pick the questions where the building itself is the best answer.
What we'd tell any apartment website owner
- Write for renters, not for your industry. Leasing tactics and management advice don't belong on a building's blog.
- Ground every post in real facts about the building: sizes, prices, specials, transit times. That's what makes a post different from the next ten.
- Look for the specific questions: affordability programs, parking, pet rules, commutes to the big local employers. They beat broad "best things to do" lists.
- Name the building early, in the summary and the first paragraph.
- Expect impressions before clicks. Five weeks in, two sites doubled their clicks. That's real, but smaller than the impressions chart suggests.
Caveats
Search Console data for these three sites only goes back to July, so the "before" period is about two months. All three were flat for eight weeks before the batch, which makes a seasonal jump unlikely, but we can't rule it out. We'll update this post with the 90-day numbers in December.